

What is a facet?
A facet is a dimension of your study: something every interview can be described by. Examples are “Brands mentioned”, “Main frustration”, “Age group”, “Shopping channel”. Each facet has a set of values (“Coca-Cola”, “Pepsi”, …), and eligible interviews can be coded with the values that fit them. Missing answers or unavailable source data can leave a facet without a value. The easiest way to picture it: one row per participant, one column per facet. In a study about coffee habits, that table might look like this:
Once an interview carries facet values, you can count it, chart it, filter by it, and cross it with any other facet — “how do brand mentions differ between drip coffee and espresso machine users?” is one facet crossed with another. Facet charts and filters make these comparisons reusable. Question coding also contains specialized analyses whose interpretation depends on the question type.
Facets exist at two levels:
- Question facets are coded from the answers to one question in your topic guide.
- Whole-interview facets are coded from the entire transcript, or come from what you know about the participant (panel demographics, screener answers, uploaded data).
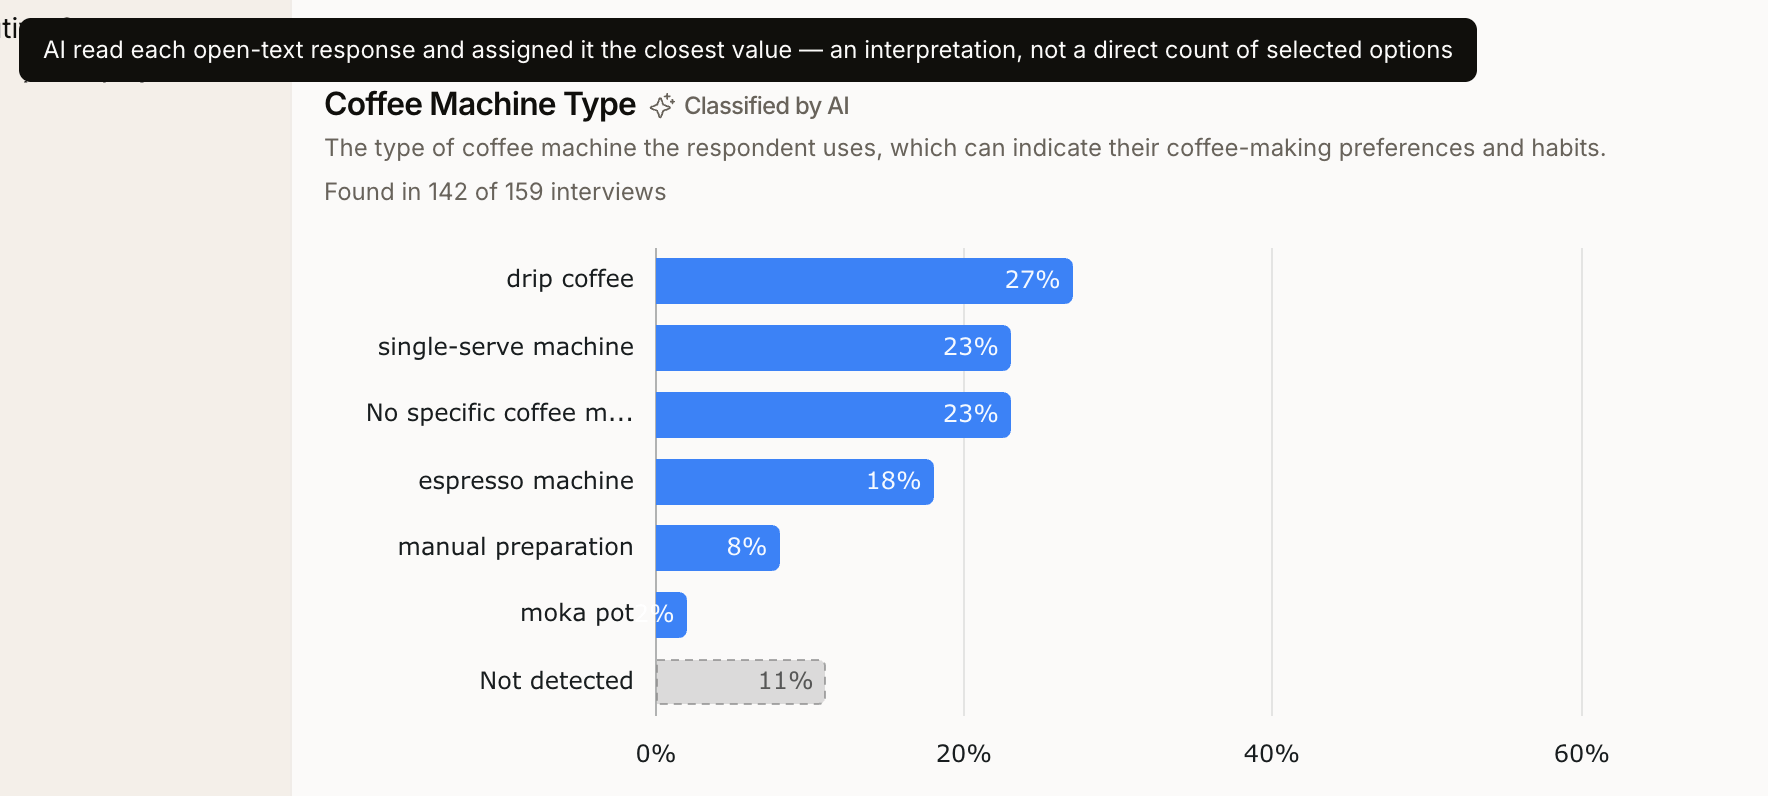
- A check icon marks a direct count of selected single-select or multi-select answer options.
- A sparkle icon and Classified by AI mark an interpretation rather than a direct count of selected options. Study-level and metadata facets do not display this indicator; an absent icon does not establish how the value was obtained.
Counts and missing data
Before comparing charts, check what is counted and which interviews are eligible:- Analysis base: Question coding excludes hidden, deleted, and test interviews and uses completed interviews. A question facet also depends on whether the interview reached that question.
- Diary quota segments: A segment based on a first-entry screener counts a participant once across repeated entries. A segment based on assigned stimuli or a screener re-asked on each entry remains entry-based, because that answer or assignment can change. Segments in the same quota group can therefore have different counting bases; check their definitions before comparing totals.
- Participants versus interviews: Participant-level facets count distinct participants. Other facets can count interviews, so diary entries can contribute more than once. Read the base shown for the chart.
- Percentages: For question-backed facets, category percentages use the detected base, capped by the eligible base. Other facets use the eligible base. Coverage and missing-data indicators help explain why the number coded can differ from the number eligible.
- Multiple values: One interview can contribute to several categories when multiple values are allowed. Category percentages can therefore exceed 100% when added together.
- Missing values: An empty value can mean missing source data, a question not reached, incomplete extraction, or no matching category. Do not treat every blank as an explicit negative response or a numeric zero.
- Emotion coverage: Emotion charts show unavailable readings separately as coverage; an absent reading is not a neutral emotion.
Where facets come from
Most facets are created for you. The Question coding page groups them by origin, so the section headings you see there are also the answer to “where did this facet come from?”.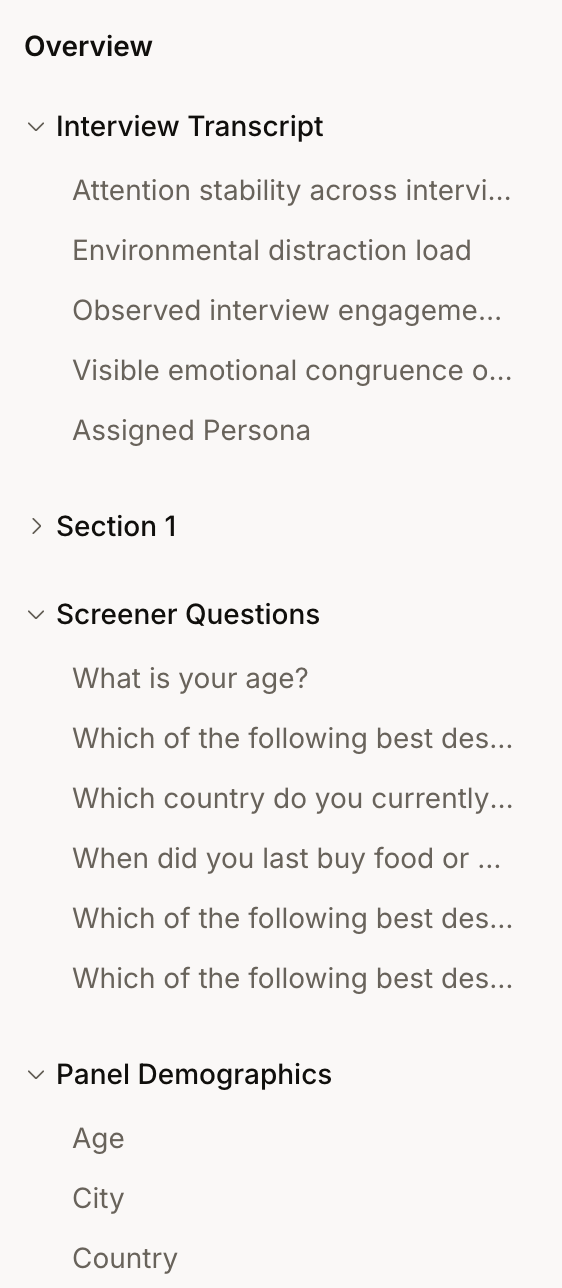
Created automatically when your study launches
Created from participant data as interviews come in
Panel data depends on what each recruitment source supplies. Similar demographic labels do not guarantee that different providers use the same categories or definitions; review comparability before combining them.
Quality measures, maintained by the system
System-maintained facets describe interview progress and quality. Some copy recorded status or measurements; the response quality score is an automated assessment:- Interview duration (min): how long the interview took, start to completion.
- Interview outcome: completed, abandoned, screened out, canceled, or in progress.
- Questions answered: how many questions the participant got through.
- Response quality score: an automated 1–10 rating of response quality.
- Word count: how much the participant said.
- Screenout reason: why a screened-out participant was turned away, where a reason was recorded.
Created by you
Three ways to add a facet yourself:- From a question: click “Create facet” below any question on the Question coding page to code a new dimension from that question’s answers.
- From the whole interview: click “Create facet” in the Interview transcript section to code a dimension from the full conversation.
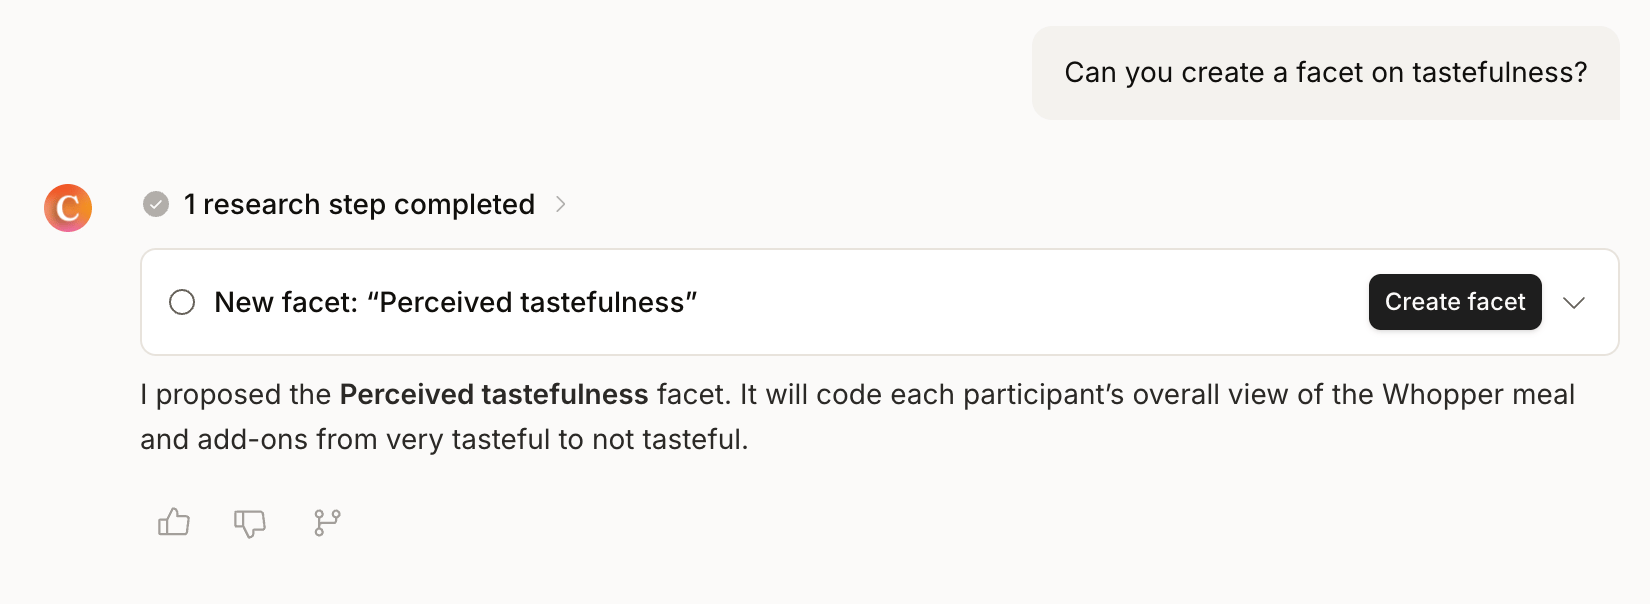
- From the Analyze chat: when a question you ask needs structured data that doesn’t exist yet, the AI proposes a facet and shows you exactly what it will code. Click “Create facet” on the proposal to accept it. Extraction runs in the background; you can keep working.
Kept clean automatically
Conveo periodically reviews a study’s facets — around the halfway mark of fieldwork, at study completion, and on every Storyline wave. This pass can discover a new whole-interview facet the corpus supports, merge duplicates, hide redundant ones, and consolidate near-identical values. If a facet appears or two facets become one without you touching anything, this is why. Values you have edited by hand are left alone.What happens when you create a facet
Creating a facet is not a one-off query — it adds a standing dimension to your study:- Existing eligible interviews are processed in the background. Extraction uses the chosen question or source. An interview without relevant data may remain uncoded; failures or processing delays can leave coverage incomplete.
- Future interviews can contribute values through the study’s analysis processing. Check the facet’s processing state before treating its counts as complete.
Combine transcript and video evidence
Use a Transcript + Video facet when a category can be established by what a participant says or what they show—for example, a brand named aloud or visible in a product demonstration. Create the facet at question or interview level and choose the corresponding Transcript + Video source. This option requires the study’s video-insights analysis to be enabled; task observation alone does not make it available. The coder reads transcript text together with descriptions from the existing video-insights analysis. It does not run a new video analysis for every facet. A value can have a transcript quote and an associated video clip as evidence; those clips do not add separate item counts just because the participant both said and showed the same thing. Check the chart’s base when comparing participants, interviews, and mentions. This is an opt-in source: automatic facet generation and existing facets are not automatically converted. Source editing is available only before a user-editable facet has detected values; create a new facet when an established facet needs a different source. For recorded interviews, coding normally waits for video insights to finish. Interviews without a recording, or for which video insights are disabled, can be coded from transcript alone. A recording that fails to produce usable video can leave the combined facet pending until the problem is resolved and the facet is recalculated. Missing visual evidence is not proof that the participant did not show something. Combined facets do not include the moments detected by task observation. The moderator’s task-observation questions and the participant’s answers are part of the transcript and are coded like any other answer. Review extracted values against the transcript and available clips; the combined source does not guarantee that a contradiction between speech and video has been resolved correctly.Ask a question or create a facet?
The Analyze chat can answer many quantitative questions on the spot, and will propose a facet when it genuinely needs one. Use this rule of thumb:
When you do create facets, three habits keep the set healthy:
- Make them composable, not combined. Facets cross with each other for free. A “Market” facet and an “AI tool used” facet already answer “German ChatGPT users” and “Swedish Gemini users” — you never need a facet for the combination itself.
- Avoid overlap. Two facets that code nearly the same thing don’t double your information; they split it. If a new facet would mostly duplicate an existing one, refine the existing one instead (see Managing a facet).
- Retire what you no longer use. A cluttered facet list makes the useful dimensions harder to find. Hide a facet to declutter without losing its data, or delete it to remove it permanently.
A definition will evolve? Edit, don’t re-create. If a facet’s meaning shifts — you rename values, tighten what counts — update the existing facet and re-analyze. Re-analysis applies the new definition to eligible existing interviews. Review dependent filters, charts, and Storyline metrics when changing or removing values; preserving the facet does not guarantee that every previous comparison retains its meaning. Creating “v2” facets alongside old ones is how facet lists rot.
Managing a facet
Quick actions live on each facet card’s ”…” menu on the Question coding page: “Duplicate chart”, switching between absolute and percentage values, “Hide chart”, and “Delete chart”. Hidden facets can be brought back with “Show hidden facets”; deleting is permanent. Hiding is a display choice, not a way to erase source data. To choose organization defaults, open Settings → Organization → Organization profile → Display preferences. Set Default facet units (unfiltered) and Default facet units (filtered) separately to Absolute or Percentage. You can still switch an individual chart through its controls. Everything else happens on the facet’s detail page — click the facet’s name on its card to open it — in the “Edit facet” panel: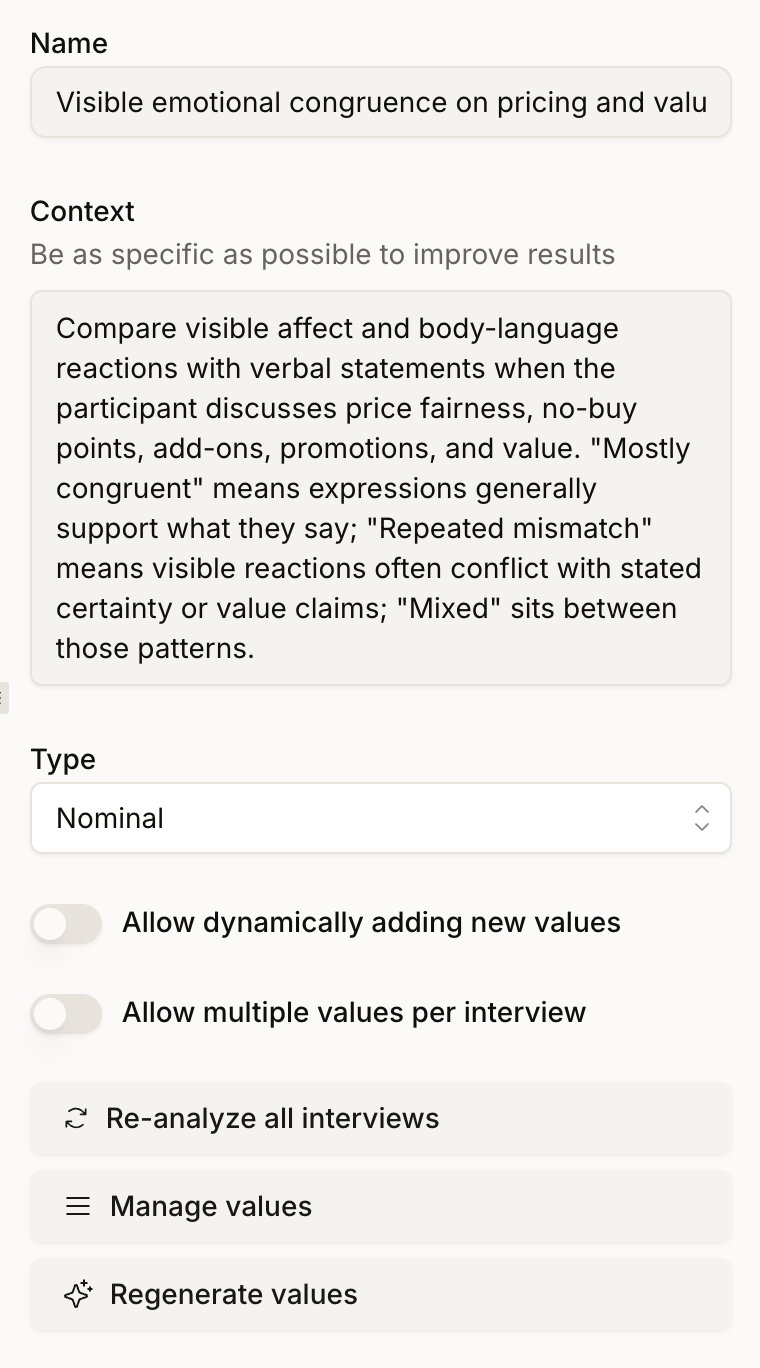
Which facets can be edited?
With study editing permission, AI-coded question, whole-interview, and video-insight facets expose definition-editing controls. Facets that mirror a source of truth are read-only: panel data, screener answers, single/multi-select questions, uploaded CSV columns, quota segments, interview language, and diary entry numbers all reflect what actually happened, so there is nothing to re-interpret. Random-stimulus, emotion-detection, and visual-verification facets also have source-controlled definitions. Derived facets are maintained through their configured source rules. Some source-controlled facets can be recalculated without allowing their definitions to be rewritten.Correcting the coding by hand
With the required editing permission, you can correct individual interview coding using the available facet controls. In a transcript, hover a participant answer and click “Add facet” to attach a facet value to that message, or click an existing facet badge to change it. Where allowed, add a new value if none of the existing values fit. Question-linked facets must match the answer’s question. A facet that allows only one value cannot receive a second value through the add dialog; edit the existing coding instead. Hand-coded values are marked as manual, count toward the facet’s charts like any other value, and survive re-analysis if you choose “Preserve manual values”.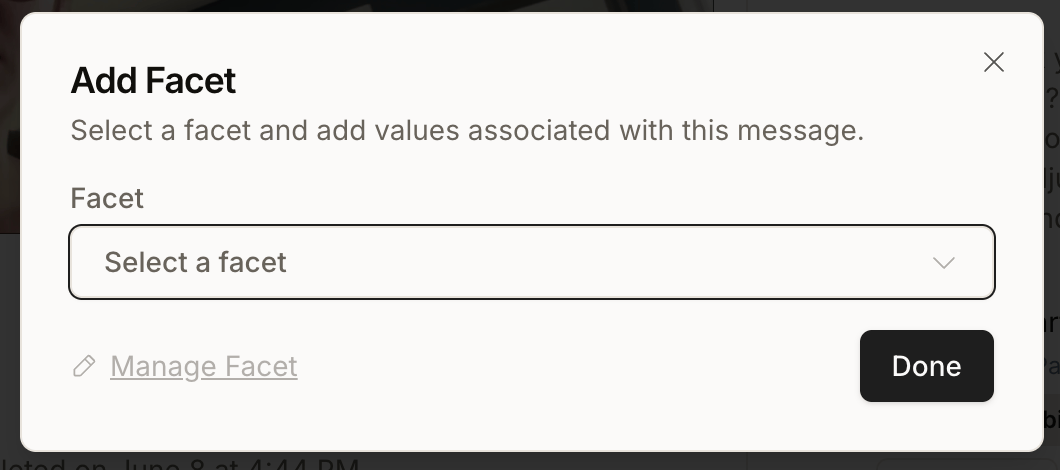
Where facets show up
- Filters — facet conditions define segments on Question coding and in saved filter sets.
- The interview grid — each facet is a sortable, filterable column.
- The Analyze chat — facets are the structured data the AI counts and crosses when you ask quantitative questions.
- Storylines — metrics track facet values over waves, and splitting a metric “by region” or “by customer tier” means splitting by a facet.
- Exports — the custom CSV export can include all facets as columns, and facet charts offer CSV or PNG exports where available.
Anything missing? Let us know at support@conveo.ai and we’ll help you out!